
I have another blog entry documenting some of the tools that I’ve used in the past while researching/collecting data related to my Family tree. This entry will focus a little more on using the D3.js library to build a nice little interactive visualization of that Tree.
Anyways, I was recently involved in a mini hackathon in work…
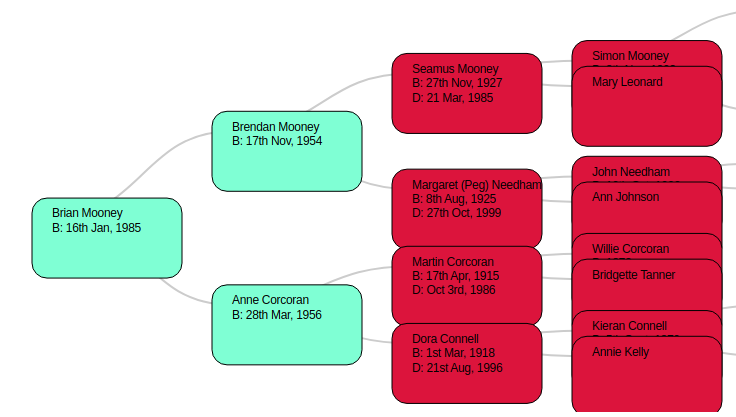
…and one of the other teams used the D3 JS Collapsible Diagram example to build a simple product hierarchy viewer. I liked the idea and thought it would work well as a family tree display.Who said ya can't have fun in a Remote #Hackathon#Beer #Pizza #FuckYouCompilerFairies pic.twitter.com/BmrMt8Jqq2
— Boring Brian 😴 (@irishshagua) December 16, 2021
Details
Building the visualization was actually pretty easy (well… let’s say robbing the work that had already been done by others and slightly tweaking it). The D3 script does everything. Embedding in the blog was relatively simple through the construction of a hugo shortcode. The hardest part was figuring out how to get the text to display in the SVG rectangles. Ideally this should have been done using a foreignObject but I had some issues getting this working so just did a positional fudge in the svg attributes. This will of course break dependening on text size etc, but it seemed fne for such a trivial visualization.
Visualziation
Gallery
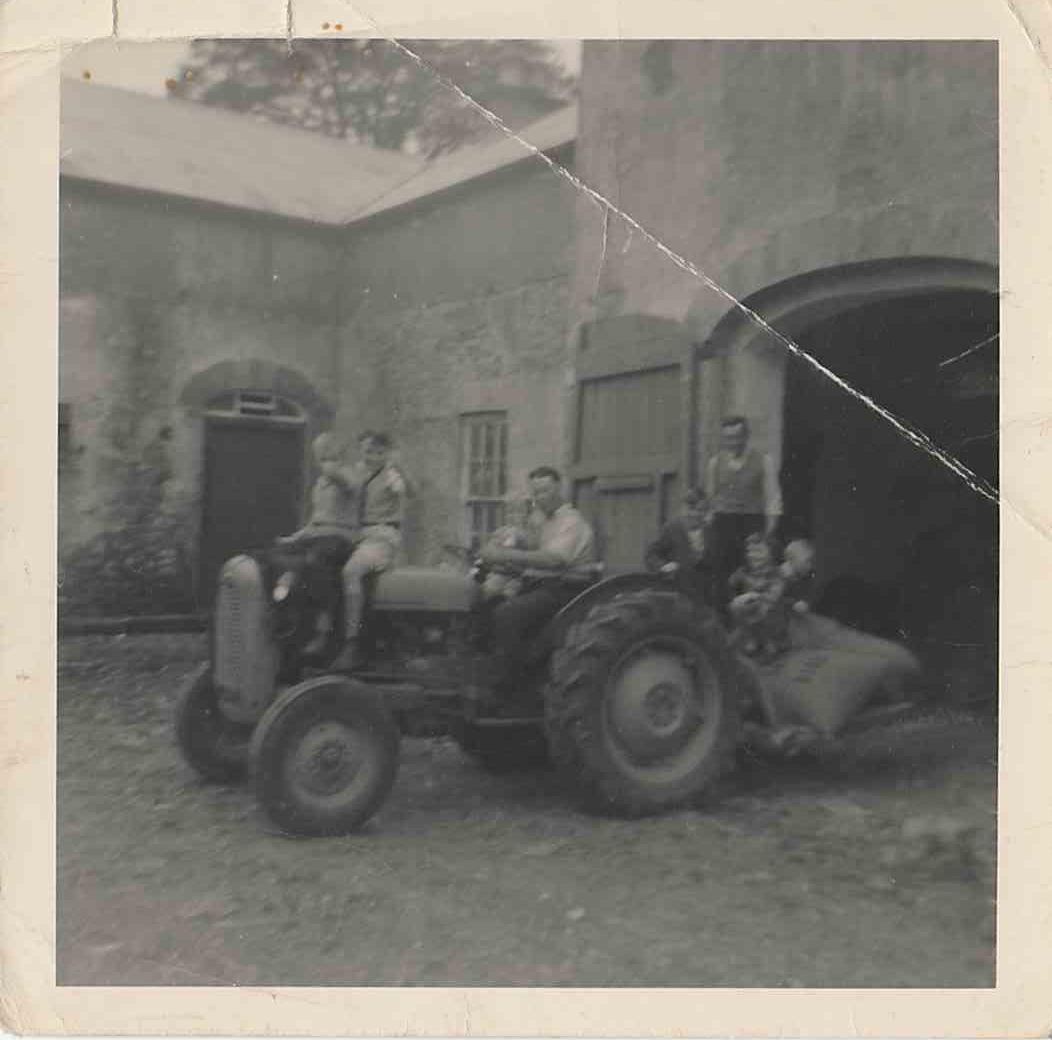
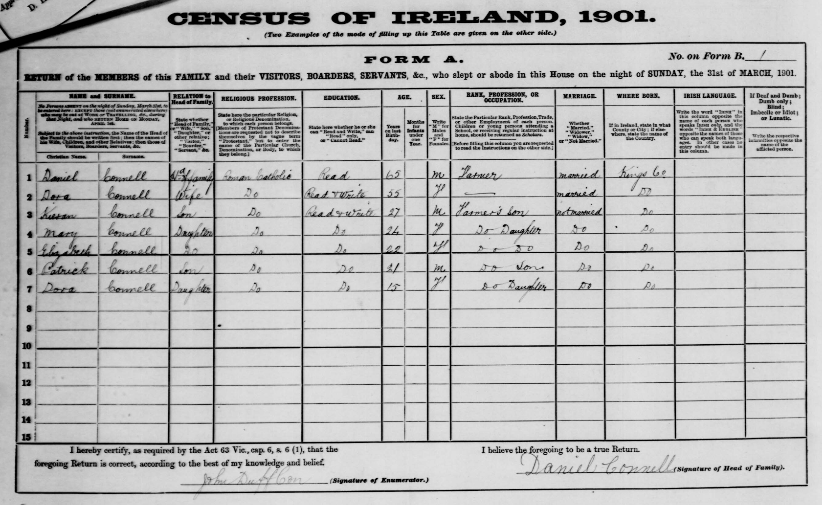
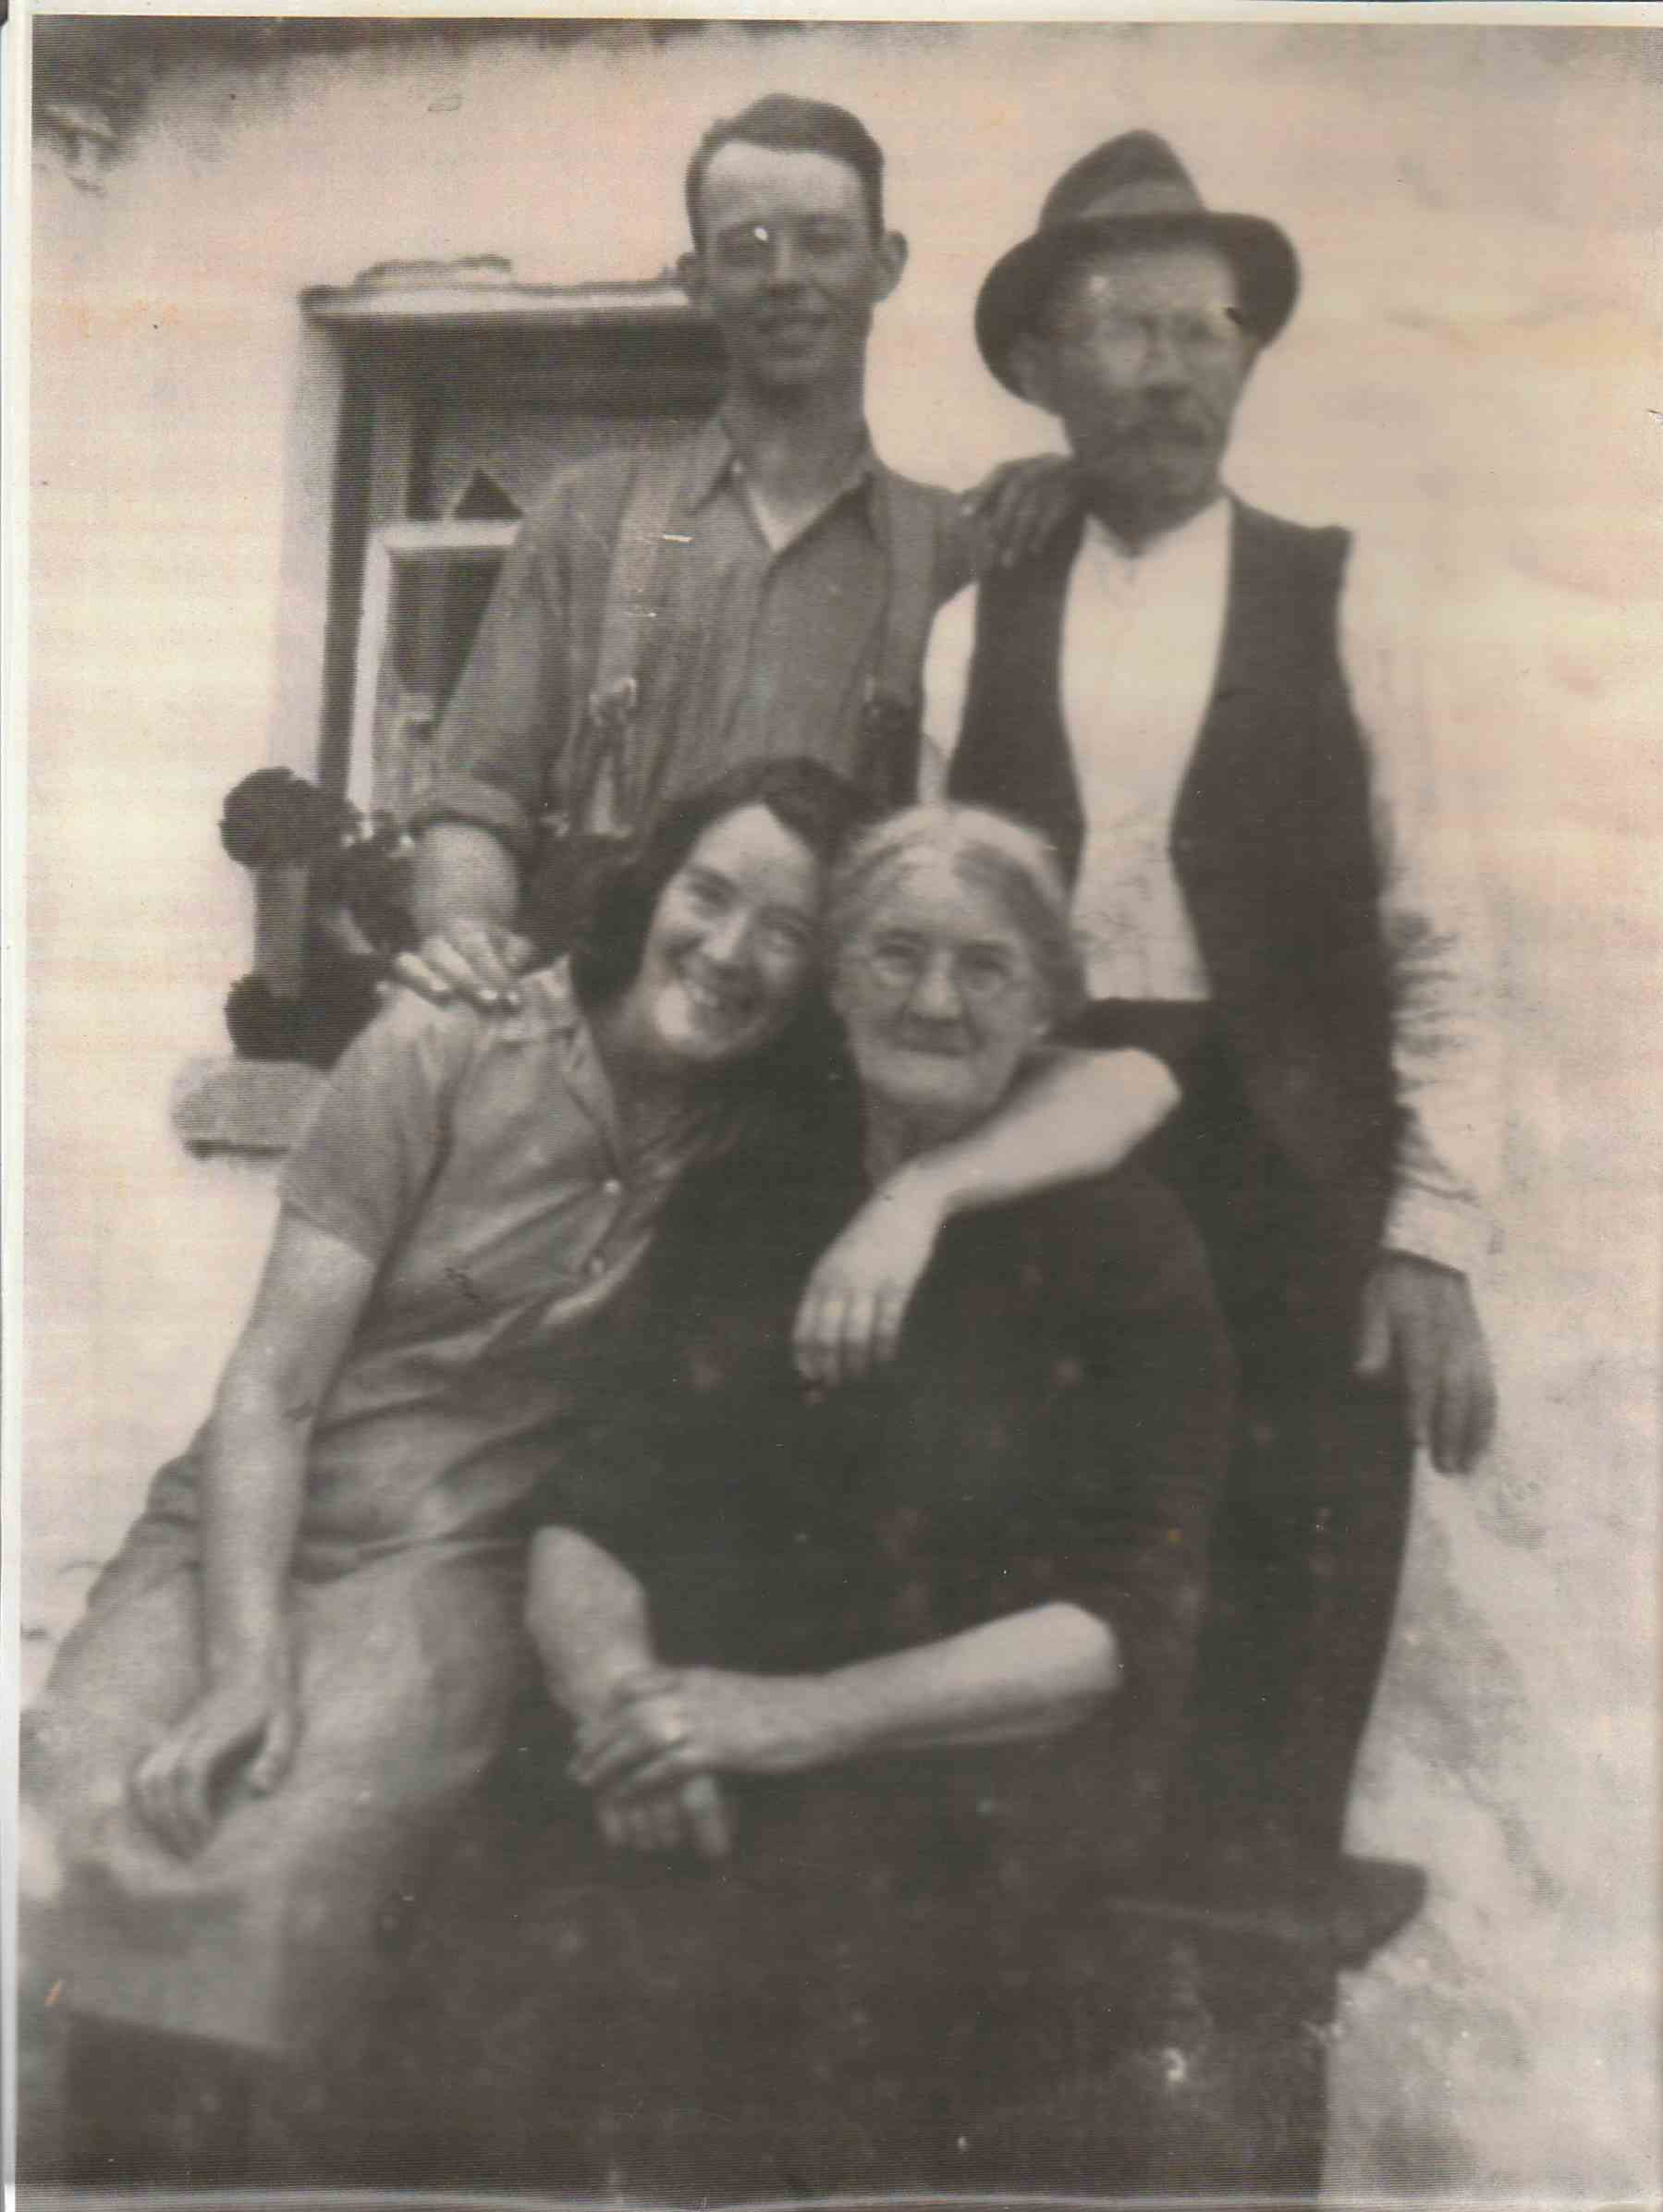
And here’s a few photos from the Family Tree research. I think it’s great to have a view of peoples (some of whom I’ve never even met, or only met before I could walk & talk) lives from a different time. It’s one of the things about my researching my genealogy that I find most interesting.


